TEXT MINING - DATA
AI ART - ART
NAIVE BAYES
This is the first part of the mod 3 text mining project assignment, exploring machine learning models and their applications to my AI/Art Text Data.


NAIVE BAYES MODELS
Naive Bayes is a supervised machine learning model used for the classification of data points: namely, text data. We call it “Naive” because the probabilistic model assumes that the ‘features’ (words) are independently indicative of the document’s label (rather than dependent on the order and co-current words in a phrase). Naive Bayes quantifies each word’s influence on the resulting label (aka: class) of a document, by multiplying together each word’s probability under either label and labeling the document by
I’ll be trying to train NB to distinguish AI Art posts/comments from art posts/comments. By predicting whether a new text sample is “AI-generated art discussion” or “human-made art discussion,” we can quantify how language differs between these communities and potentially flag AI-centric discourse.

After converting the text into a document–term matrix, the data was split into two files: training_set.csv contains the term count features and labels for the documents used to train the Naïve Bayes model, and testing_set.csv contains the other portion of the dataset that was held back in order to test the trained model’s ability.
Naive Bayes at first had an overall accuracy of 80 percent.
Taking a close look at the confusion matrix, we can see that: in the 100 total AIArt documents, only 86 were correctly identified (this is called ‘recall’). 14 were mislabeled as ‘Art’ discussions. On the flipside, of the 87 total art documents, only 64 were correctly labeled (74% compared to the AIArt’s 86% recall). Thats 23 Art discussions mislabeled as Art.
The Naive Bayes model is much better at identifying conversations surrounding AI Art than it is at defining a discussion about Art.
The F-scores (0.82 for AIArt, 0.78 for art) tell us that it ‘understands’ both classes about the same, rather than knowing one label better than the other. I think this shows that AIArt discussions online tend to use a relatively narrow vocabulary. The dataset doesnt include many AI specific words like ‘prompt’ or the names of any specific models as a part of my datacleaning: so this likely means theres a number of really specific topics that are popping up often enough in my data, which make it easier to identify than the much broader category of “art’.
Of course, in order to train the model, the data must be converted into a format it will understand. Naive Bayes is a probabilistic model: it needs NUMBERS to do the math.
I used count vectorization to transform my data to a docuemnt term matrix, where all the words in the vocabulary become columns and each row contains a number for how many times each term appears. The max_df parameter drops any term that occurs in more than 10 % of documents to remove overly common tokens, token_pattern uses some regex to restrict features to only alphabetic tokens of at least three characters (filtering out punctuation, numbers, and tiny fragments like ‘im’), and stop_words (a combination of scikit-learn’s English stop words plus the keywords like “AI,” “art,” and “Midjourney”) ensures that generic filler words and the very terms used to collect the data are excluded.


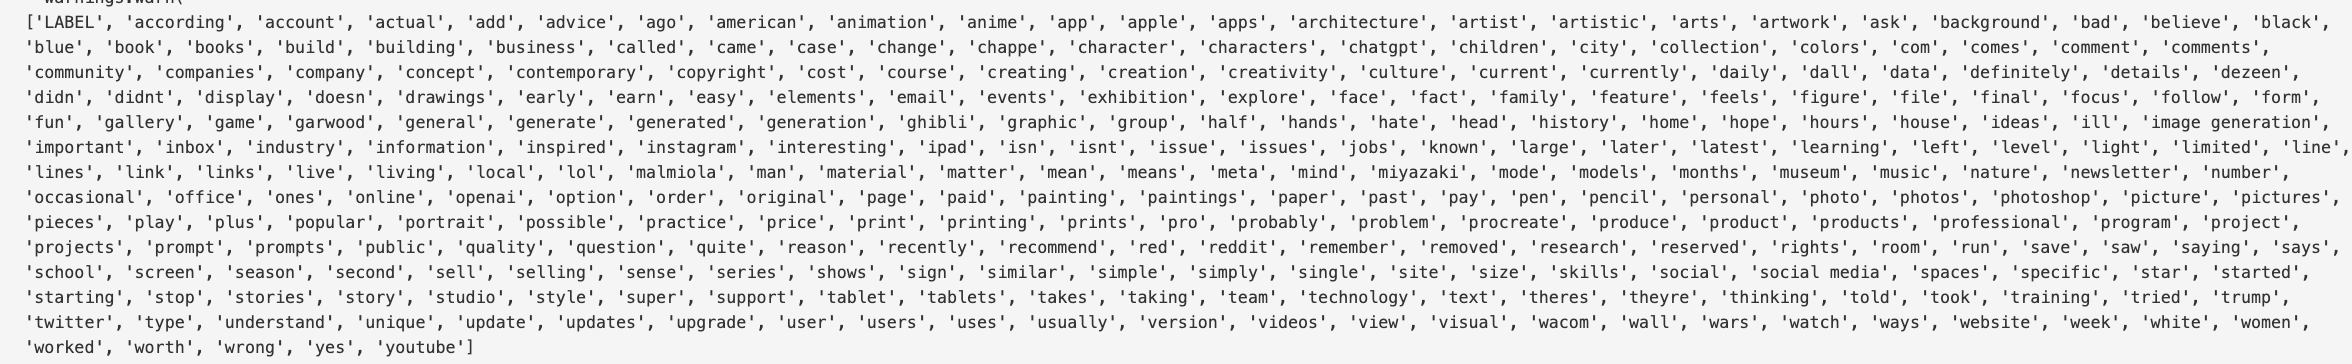
A “supervised” machine learning model is one that learns from LABELED data. My master labelled dataframe is to the right—the label is what the model will consider ‘classes’: AIArt or Art. The model’s job is to discover which vocabulary patterns distinguish those classes.
I sourced raw text from Reddit posts (via the Reddit API) and news articles (via NewsAPI), then scraped full-article content and rigorously cleaned out HTML, boilerplate, and irrelevant snippets. The result is a simple table that suits the distinction of a LABELED DATASET: one document per row, with a LABEL column for its class and a TEXT column for the cleaned content.
In order to set myself up for success, before training, I verified that AIArt and art were represented in roughly equal numbers (see the bar chart). The smaller bar charts show us how the labels were represented in the data from either source.


